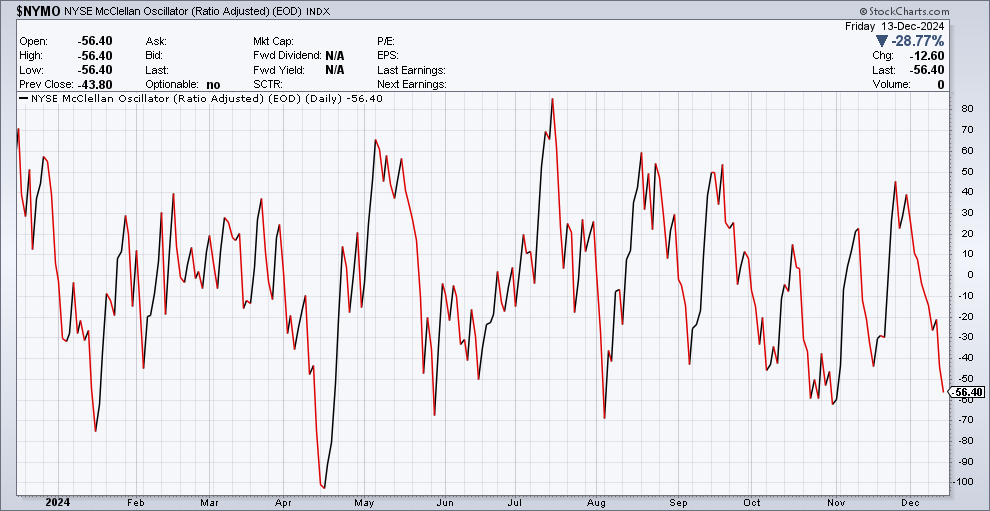
Another updated look at inflation shows that pricing pressures keep moving in the wrong direction. The Consumer Price Index (CPI) gained 2.7% in November compared to last year, while the core figure that excludes food and energy prices rose by 3.3%. The headline figure accelerated from the prior month’s 2.6% pace, while core inflation bottomed in August and has trended sideways the past three months. The Producer Price Index (PPI) jumped 3.0%, which is the largest gain since February 2023. It’s also worth noting that the PPI tends to lead changes in the CPI as you can see below. The chart plots core PPI (blue line) and core CPI (red line), with core PPI crossing above CPI in November’s figures.Many economists are dismissing the acceleration in CPI and PPI over the past month to rising food prices. For instance, food prices accounted for around 60% of the PPI’s monthly increase with egg prices up 55% alone. The chart below shows an index of agricultural commodities, which are up nearly 30% year-over-year and are recently breaking out to the highest levels in over 12 years.Chart from Tavi Costa on XWhile many economists are pointing to one-off factors that are driving recent increases in inflation, some alternative measures of core inflation show that pricing pressures are persistent. The Fed’s “supercore” measure that looks at core services excluding home rents has averaged 4.3% over the past three months. Another measure of core goods that excludes food and energy shows the annualized pace over multiple lookback periods is turning higher over the past couple months (chart below).Chart from Nick Timiraos on XThe average stock is lagging badly during a historical period of weak seasonality for the S&P 500. Mid-December tends to see a volatile stretch for the S&P 500 looking at historical trends over the past 20-years. And right on cue, there have been more declining stocks than advancers for 10 straight sessions for holdings in the S&P. That’s the longest streak since October 2000. Across the major exchanges, there are now only about 39% of stocks trading above their 20-day moving average (chart below). That’s a way of gauging how many stocks are trading in short-term uptrends.As the average stock is pulling back, some measures of stock market breadth are reaching oversold levels. The McClellan Oscillator in the chart below looks at advancing versus declining stocks on the NYSE over a trailing period. You can see the oscillator is approaching oversold levels seen during periods like the start of November and first week of August that saw broad rallies unfold.After a short-term period of seasonal weakness, a strong three week stretch is coming up for the S&P 500. The chart below shows the S&P 500’s seasonality during election years going back to 1928. If those seasonal trends hold up, then a rally into mid-January could start this coming week. That makes emerging signs of oversold breadth conditions quite interesting against the backdrop of historic seasonal trends.Chart from Seth Golden on X

S&P 500: Breadth oversold as a seasonal sweet spot begins. | by Mosaic Asset | Coinmonks | Dec, 2024
-


